DISCLAIMER
This report by Adam Khoo, Adam Khoo Learning Technologies Group Pte Ltd and Piranha Ltd. is in no way a solicitation or offer to sell securities or investment advisory services. Adam Khoo, Adam Khoo Learning Technologies Group Pte Ltd and Piranha Ltd. is not intended to be a source for professional advice. Participants should always seek the advice of an appropriately qualified professional before making any investment decisions.
Information throughout this report and accompanying materials, whether stock quotes, charts, articles, or any other statement or statements regarding market or other financial information, is obtained from sources which we, and our suppliers believe reliable, but we do not warrant or guarantee the timeliness or accuracy of this information.
Nothing in this report and accompanying course materials should be interpreted to state or imply that past results are an indication of future performance. Neither we nor our information providers shall be liable for any errors or inaccuracies, regardless of cause.
This report and accompanying course materials may include forward-looking statements. All statements other than statements of historical fact are forward-looking statements (including words such as "believe", "estimate", "anticipate", "may", "will", "should" and "expect").
Although we believe that the expectations reflected in such forward-looking statements are reasonable, we can give no assurance that such expectations will prove to be correct. Various factors could cause actual results or performance to differ materially from those discussed in such forward- looking statements.
Historical performance is not indicative of future results. The investment return will fluctuate with market conditions. Performance is not indicative of any specific investment or future results. Views regarding the economy, securities markets or other specialized areas, like all predictors of future events, cannot be guaranteed to be accurate and may result in economic loss to the investor.
Investment in securities, including exchange traded funds (ETFs), and Contract for Differences (CFDs) involves the risk of loss. There are no warranties, expressed or implied, as to accuracy, completeness, or results obtained from any information presented in the report and its accompanying course material.
1 Feb 2020
The Much-Awaited Correction is Here
After continuously rising for 3 months, the long-awaited correction is finally here. It was not a
disappointing economic indicator or crazy tweet that triggered the sell-off but the sudden emergence of
the coronavirus epidemic. Once again, it shows that it is impossible to predict when or what will cause the
market to sell-off.
The good thing is that investing success has nothing to do with making predictions of how market prices
will move in the short term. Investing success has to do with focusing on the underlying fundamentals of
the businesses behind the stocks (earning growth and valuation) we own as well as their current trends
(price action).
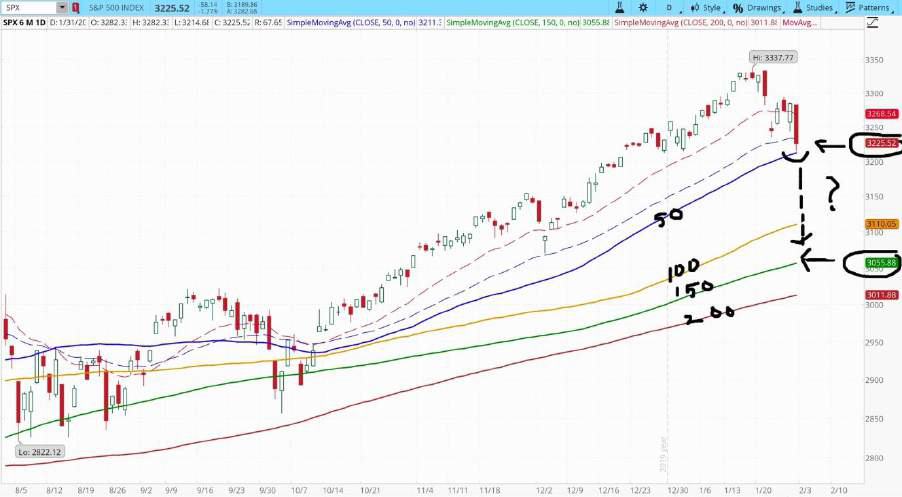
Since the start of the sell-off, the SPX is down 4% from its highs and is resting at the 50MA. So far, this is
just a minor pullback. There is no way to know how deep this correction will be. A pullback of 5% to 15%
is still a very healthy retracement on an uptrend and a great chance for investors to add shares to their
favourite companies and to index ETFs.
We have to see if SPX can hold this level in the next few days. If it breaks below this level, then the next
support will be at 150MA (3,055). This would represent a 10% pullback from the highs. At this level, I
would probably be adding shares to the S&P 500 ETF (SPY).
S&P 500 (SPX) Daily Candles
The Shanghai Stock Exchange has been closed since Jan 24th and will only open on Feb 3. That’s 11 days
that the China exchange has been shut since the start of the Lunar New Year and the start of the
outbreak.
I will be waiting for the Shanghai market to open on Monday (3 Feb) to see the extent of the expected
sell-off in mainland stocks. While the China market was closed, US listed ETFs that track china stocks have
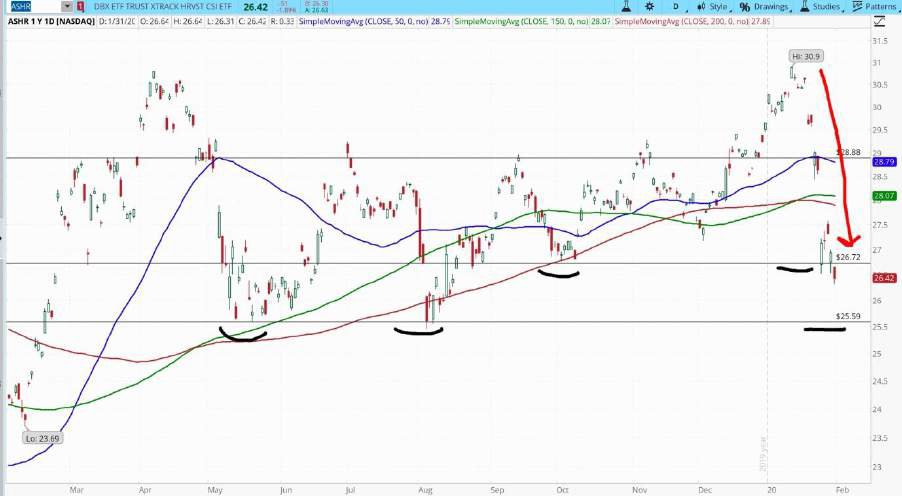
already been pricing in the expected fall in their underlying securities. The ASHR ETF (tracking Shanghai
Index) is down 15% from its high of $30.90 to $26.72. As you can see from the chart below, the next level
of support is $25.59. If it can get a strong bounce there, I will add shares to my position as well.
It would be interesting to see if the Shanghai Index will fall by 15% as well on Monday, as reflected by this
ETF.
ASHR ETF (Daily Candles)
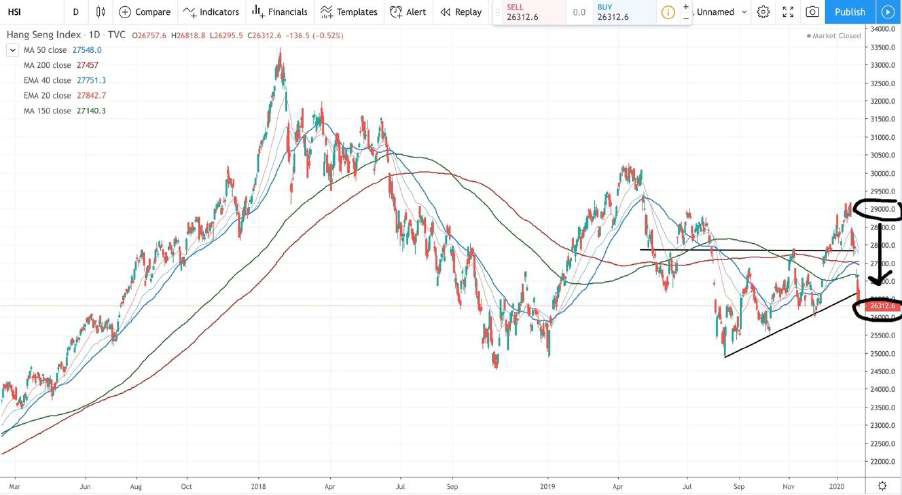
Meanwhile, the Hong Kong market has been open all this while and has fallen 10% from 29,000 to
26,312. My core china stock holdings like Tencent, Alibaba, Meituan and Ping An have all fallen in line
with the broader market.
Hang Seng Index (Day Candles)
How Much Worse Can it Get?
A question of course in everyone’s minds is how much worse can it get? There is of course no way to tell
how long this epidemic will last and the eventual economic impact it will have on China and even the
world’s economy.
This will definitely shave some points off China’s GDP this year and contribute to a slowdown in its
growth. The bullish trend in China stocks has definitely been set back just when the China bull market
was gaining steam. For now, it looks like prices are going back into a consolidation and we will see if this
will reverse into a bigger downtrend pattern.
As for the US markets, I doubt that this event will develop into a bear market For now, even with another
10% drop, I see it as a healthy correction on its uptrend.
U.S. GDP has been growing steadily (+2) over the last few quarters. In fact, economic growth should
improve with the easing of trade issues following the signing of the phase one of the U.S.-China trade
deal.
Corporate Earnings growth is also set to resume in the first quarter of 2020 and is on track to accelerate
in the back half of the year. Bear markets are primarily triggered by the excessive hikes in interest rates in
a period of high inflation and excessive household and corporate debt. This is not the case right now.
Inflation is low and the FED is maintaining a loose monetary policy, at least until the US elections in
November.
History of Epidemics and Its Impact
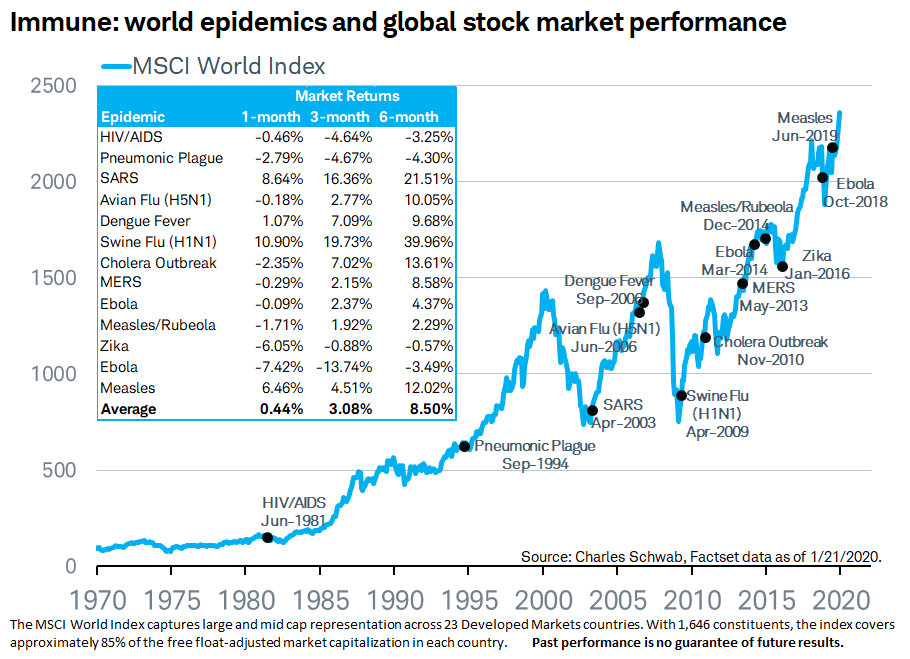
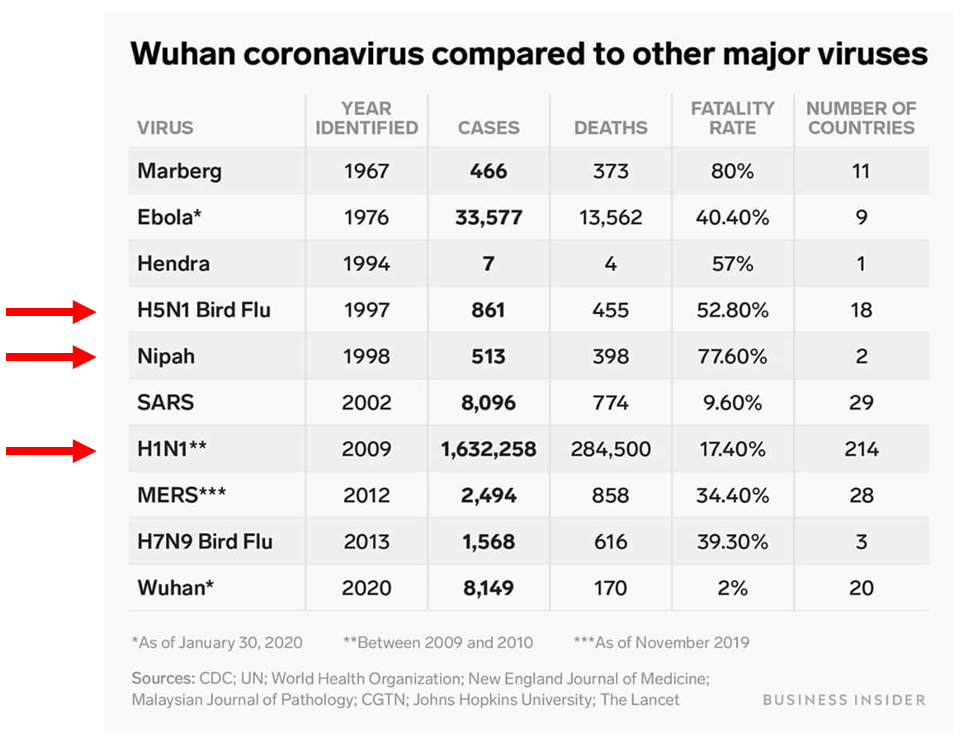
In the chart below, you can see the impact that past epidemics have had on global stock markets. No
matter how bad it has been (H1N1 was much worse with 1.6 million infected from 214 countries and a
17.41% fatality rate), it will end eventually. When it ends, stock markets will always recover and climb to
new highs.
Note that SARS came right after the Dot com crash in 2002 and H1N1 came right after the Subprime
mortgage crisis in 2009

While the SARS virus (2002-2003) hardly affected the US markets, it caused an 18% sell-off in the Hong
Kong Hang Seng Index for 21 weeks (5.2 months). Once the market bottomed, it gained +69% in the next
6 months. By the end of the year 2003, both US and China markets ended up with double digit returns.
Retail Investor- Panic Sell Low, Confident Buy High
In situations like these, the average retail investor would usually panic and sell their shares (usually at the
worst possible low price and at a loss) hoping to avoid further losses… hoping to get back into the
market the when the crisis is over.
What usually happens is that by the time the crisis is over, stock prices will once again be at new all-time
highs. This pattern of selling in fear and buying back when there is optimism leads to consistently selling
low and buying high, The result? Consistent losses in their investments.
Opportunity in Crisis
As an intelligent investor, you have to focus on the fundamentals of the businesses behind the stocks you
own. Have the fundamentals really changed?
I know for a fact that the stocks I own like Amazon, Facebook, Tencent, Alibaba, Nike etc… are still
generating higher sales and higher profits as the stock market comes down. Their competitive
advantages and solid business models are very much intact.
They are still the SAME COMPANY as compared to a week ago and yet they are selling at prices that are
10% to 20% lower! They are selling at lower prices because of emotional selling by retail traders or by
short term focused algo-trading programs that are programmed to sell when specific price levels are
reached.
Even if certain businesses ARE materially affected by the outbreak (e.g. airline, retail or hotel stocks) and
do suffer fall in profits, you have to ask yourself, ‘ will this crisis last forever?’’ Will the crisis eventually
come to an end?” If it will come to an end, then this crisis presents an opportunity for investors to buy
into great businesses at temporary discounted prices.
“ The way to get rich is to buy when there is blood running in the streets, even if the blood is yours”-
Barron Rothschild.
“ The stock market is a device designed to transfer wealth from the impatient to the patient” – Warren
Buffett
Adding to Great Stocks at Discounts
While it may not feel good to see the value of your portfolio fall during a market correction, professional
investors know that it is an inevitable part of the game. The market must ‘breathe in’ in order to ‘breathe
out’ to a much higher level.
I always remind myself that for every 1% my portfolio pulls back, it will eventually move higher by 3% to
4%. As long as I have fundamentally solid companies with wide economic moats in my portfolio, they will
always be worth much more eventually. Any short term volatility is irrelevant in the grand scheme of
things. In fact, short term volatility is an investors best friend… it allows us to constantly add more shares
at discounted prices.
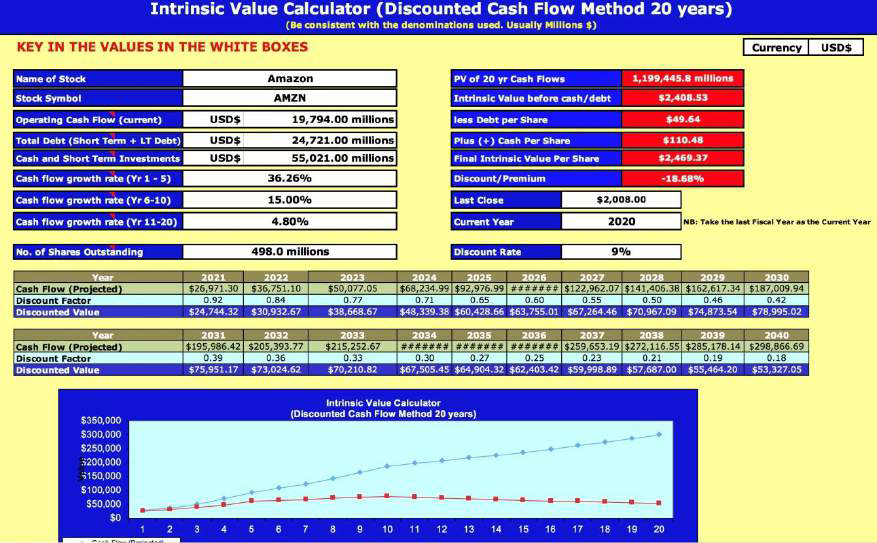
Keeping the Faith in Amazon (AMZN)
Most people were bearish on AMZN for the last 5 months (Aug -Dec 2018). The stock price kept going
sideways as the S&P 500 was making news highs.
While retail investors were selling in frustration or avoiding the shares, I was happily adding more and
more shares because I knew that at $1,700 to $1,800, the shares were dirt cheap. My intrinsic value
calculator told me that the shares were easily worth $2,400 per share and I knew it was only a matter of
time the market would reflect that.
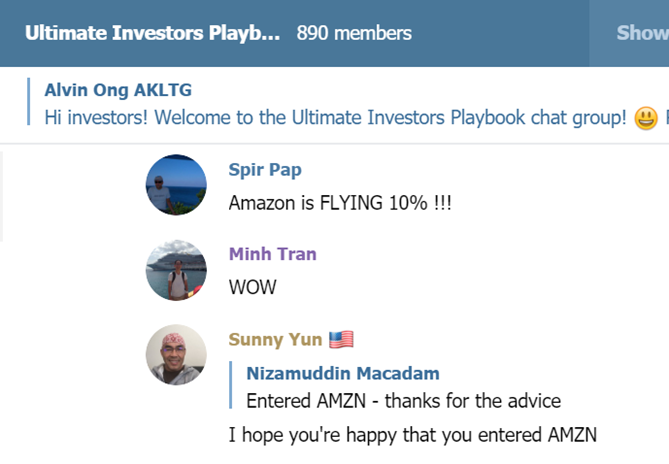
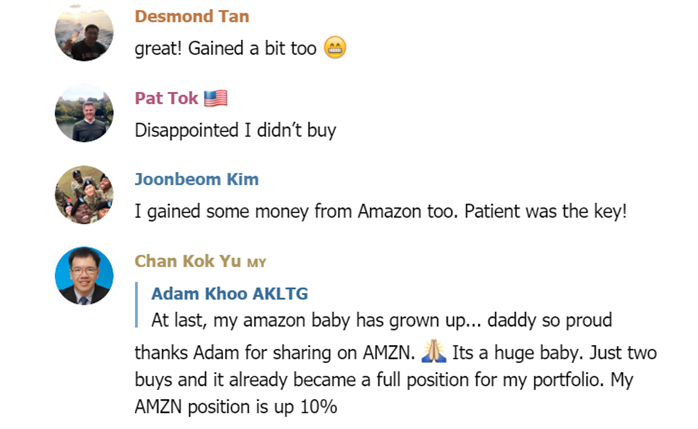
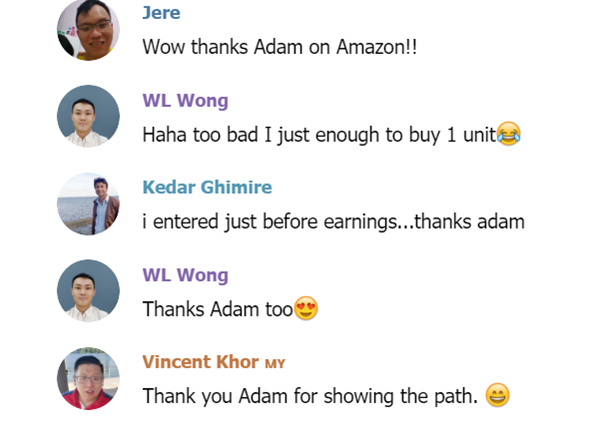
Sure enough, my confidence in my analysis and patience paid off. AMZN crushed its recent earnings
report and shares gapped up to over $2,055 per share. Check out these ecstatic messages from subscribers of my Ultimate investors Playbook… they took action on this great company after reading my stock analysis.
I am now looking to add even more shares as I know value it even higher given its latest financial performance. I am hoping the shares can pullback to $1,900 to $2,000 for me to buy more. My next target would be $2,500 to $3,500 per share over time. Based on a 20 Year Discounted Cash flow of AMZN, its shares are worth $4,747.

Given that AMZN spends a huge amount of its cash on capital expenditures, I could be more conservative and discount the ‘Free Cash Flow (FCF)’ instead of the usual ‘Cash Flow from Operations’. Free Cash flow is Cash Flow from Operations less capital expenditures. Even with this, AMZN is still worth $2,469 per share. At $2,000 per share now, it’s selling at a 19% discount… a great deal for an amazing company that is monopolizing global e-commerce sales and online advertising.
For those of you who think that $2,000 per share is out of your budget within your portfolio, the great
news is that you can now buy ‘fractional shares’ through brokers like interactivebrokers.com. So, instead of
buying 1 share of AMZN at $2,000, you could buy 0.1 shares at $200 or even .001 shares at $20… this
makes it affordable for anyone to own higher priced shares.
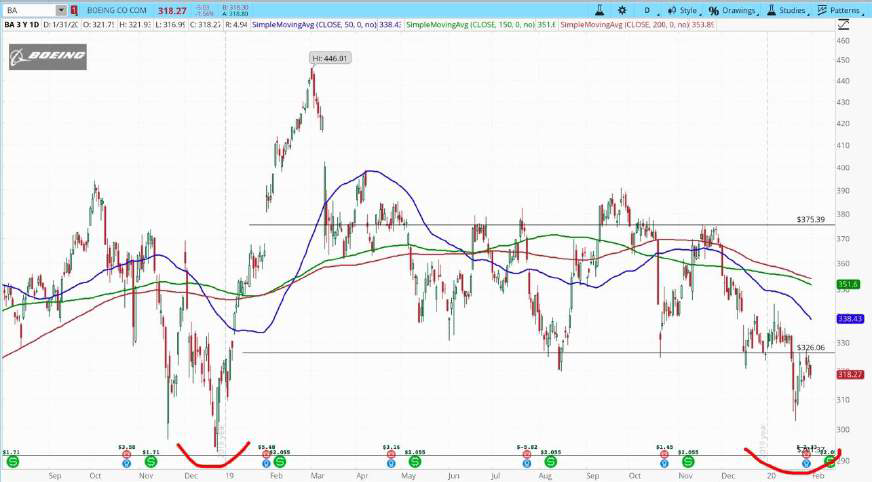
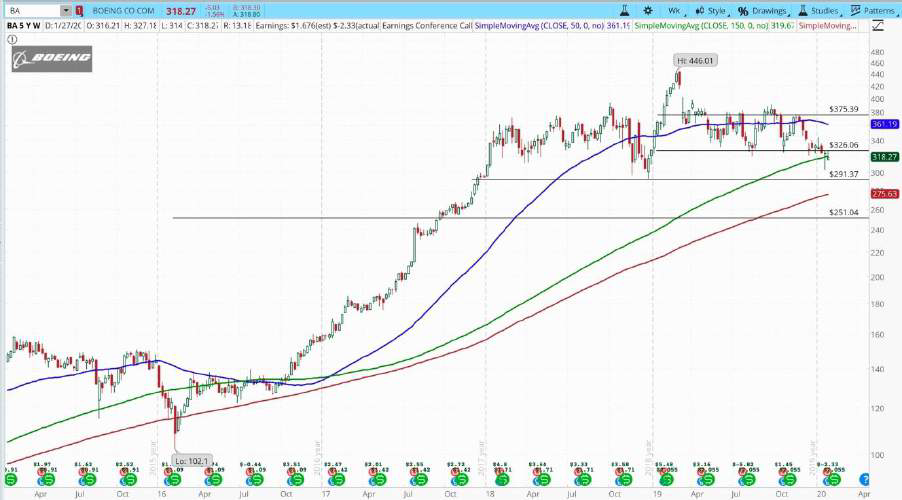
Boeing Still Not Flying
Of course, not all stocks will reap rewards as fast as you want them to. Boeing (BA) is such the case. BA is
the only stock in my portfolio of 30+ that is still below its purchase price.
It seems that the bad news never stops coming for Boeing. I first bought in BA at an average price of $338
after the 737 Max 8 planes were grounded (March 2019) following the Lion Air and Ethiopia plane crashes.
At first, I thought the company would resolve the issues quickly and the plane would start flying again in
just a few months. The company seemed to have laid out a clear plan to get the aircraft back in the air:
update its software glitch, pilot displays, flight manuals and crew training.
Then, the headlines revealed deeper issues… a culture of coverups, design problems, further software
problems and continued grounding of the max fleet, eventually leading to the firing of the CEO. The share
price continued to fall and is now at a crisis low of $318.
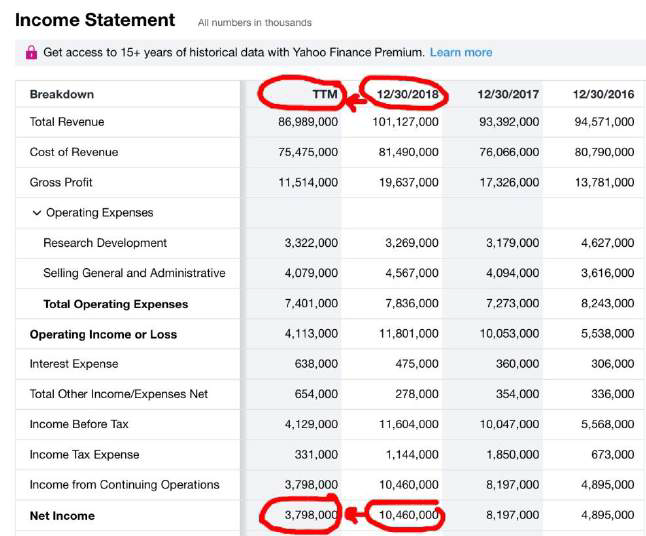
With recent BA’s 2019 4th quarter results, we can see the huge fall in revenue, net income and cash flow for
the last 12 months, as the result in its fall in orders, deliveries and order book.
With BA’s plane grounding being extended to mid 2020, the company expects a total of $18.6 billion in
costs related to the crisis. This included airline compensation, expenses related to halting production and
reduced profits. If you divide this by 564.2 million shares, this comes up to $32.96 loss per share.
Despite all these problems, I am still holding onto my shares. As an investor, I am not holding on because I
do not want to sell at a loss. I have no problem with that. If I thought that the company would not recover,
I would sell at a loss with zero emotions and just redeploy the capital into a better company that will get
my money growing again.
I am holding on because I believe that BA maintains its wide economic moat and it will get past these
temporary problems. When it does, the shares would be worth much more. Boeing is still the biggest
producer of aircraft in the world and is more than likely to recover financially when the groundings
eventually lift.
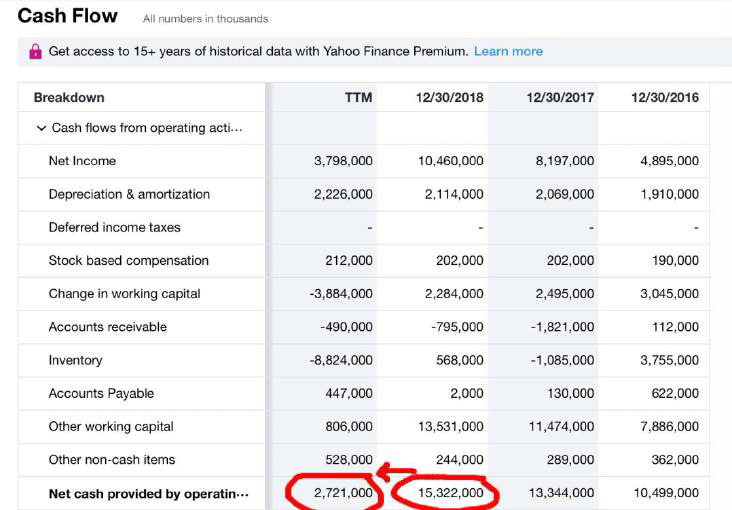
What is tricky is the valuation of its shares. I cannot simply take the latest cash flow from operations (i.e.
$2,721 million) and punch it into the intrinsic value calculator. This would give an intrinsic value of only $60
per share. This exceptionally low number is caused by its temporary production halt.
At the same time, it is also unrealistic to take its pre-crisis cash flow from operations of $15,322 million.
This would value the shares at $456.55 per share.
I assume that once the 737 Max 8 is approved by mid 2020, BA’s production is going to be set back by a
year as it may take a year or so to get back to its pre-crisis production levels. By taking FY 2017 Cash flow
from operations of $13,346 million, I would get an intrinsic value of $393 per share.
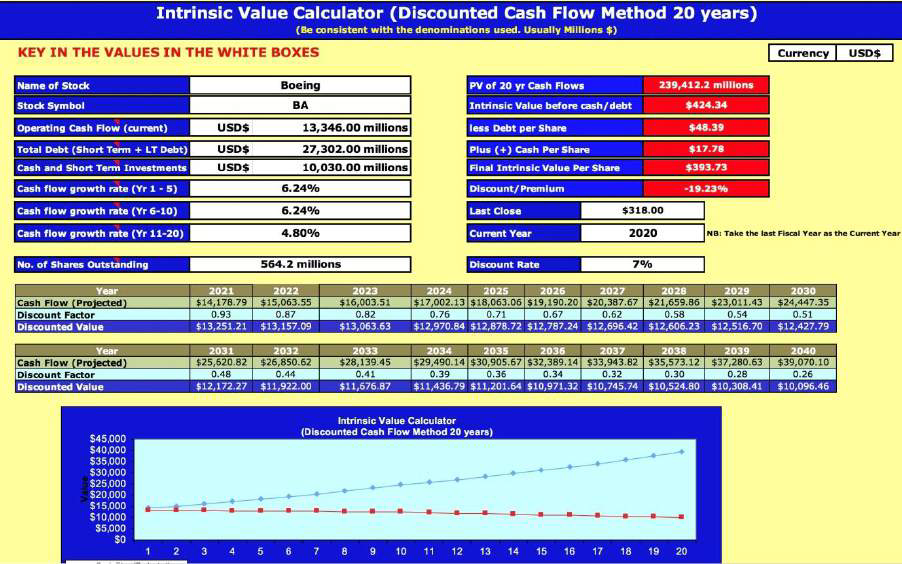
At the same time, I deduct $32.96 cost per share from the crisis and this gives me $393 - $32.96 = $360.04.
So, at the current price of $318. BA is about 12% undervalued.
While I am holding my current position, I am also not adding more at this point. Based on the charts, on
day candles, the price is within a downtrend within a larger consolidation pattern. I see the price
potentially going down to $290 (next level of support) where I will then add more if I see a bounce off that
level. In the meantime, I have also bought Boeing Put Spread Options to hedge against anymore short
term potential downside.
BA Day Candles
This market correction is giving me the opportunity to add more shares to my core stock holdings as well as adding some new stocks on my watchlist
To get my most profitable investment ideas and stock analysis sent to you every month, click here to check out my Ultimate Investors Playbook.
May the markets be with you,
Adam Khoo